Data on the climate and ecological emergency in Sutton
Data on how climate change is impacting and will impact our borough.
Increased carbon dioxide emissions are having an impact on our planet, driving up global temperatures. This affects our environment, weather and ecosystem.
We need robust and rapid action to stop producing emissions to reach a net zero carbon environment. Net zero carbon means that the carbon emissions produced are either eliminated, reduced or balanced through the removal of carbon from our atmosphere.
Sutton's biggest sources of greenhouse gas emissions
The latest available data for the UK is collected by the Department of Energy Security and Net Zero and dates from 2005. The top three sources of emissions in Sutton are:
- domestic gas
- road transport (minor roads)
- domestic electricity
How climate change will affect Sutton
Using data from Climate Just, we’ve created a set of maps to highlight the areas of the borough that are most likely to be affected by climate change and where impacts on wellbeing could be felt.
The neighbourhood data comes from publicly available sources, including the UK 2011 population census.
Community flood risk
These maps look at where social vulnerability and exposure to flooding coincide in a neighbourhood.
Maps are available for flooding from rivers and flooding from surface water due to heavy rainfall.
We model the risk in the present day and two future scenarios:
- an increase of 2 degrees in global mean temperature by 2050
- an increase of 4 degrees (both compared against a baseline taken from 1961-90)
Social flood risk from rivers
This map shows the social flood risk on neighbourhoods from rivers in the borough.
The progression is:
- at the present date, there is a low risk to parts of Hackbridge, Beddington, St Helier West, and Sutton North
- in 2 degrees of warming, the risk becomes moderate for Hackbridge and Sutton North
- in 4 degrees of warming, the risk becomes moderate for Hackbridge, Sutton North and St Helier West
Social flood risk from surface water
This map shows the social flood risk on neighbourhoods from surface water in the borough.
The progression is:
- at the present date, there is a low risk to high risk for parts of St Helier West, St Helier East, Hackbridge, the Wrythe, Sutton North, Sutton West and East Cheam, Sutton Central, Belmont, Wallington South, and South Beddington and Roundshaw
- in 2 degrees of warming, the risk becomes acute or extreme for most of the same areas
- in 4 degrees of warming, the risk becomes extreme for most of the same areas
Social flood risk to individuals from rivers
We also map the risk to individual properties. We do this by dividing the neighbourhood risk by the number of people living in that area. This helps to identify neighbourhoods where few people may be at risk but their vulnerability is high.
The progression is:
- at the present date, there is a low risk to parts of Hackbridge, Beddington, St Helier West, and Sutton North
- in 2 degrees of warming, the risk becomes very high for parts Hackbridge and moderate for parts of St Helier West
- in 4 degrees of warming, the risk becomes high for parts of Sutton North
Social flood risk to individuals from surface water
This map shows the flood risk to individuals for surface water in the borough.
The progression is:
- at the present date, there is a low to moderate risk for parts of St Helier West, St Helier East, Hackbridge, the Wrythe, Sutton North, Sutton Central, Sutton West and East Cheam, Sutton South. There is also a high risk in parts of South Beddington and Roundshaw, Wallington, and a very high risk in parts of Belmont.
- in 2 degrees of warming, the risk becomes moderate for more parts of the same areas, very high in parts of South Beddington and Roundshaw, Wallington, and acute in parts of Belmont.
- in 4 degrees of warming, the risk becomes very high in parts of Hackbridge, South Beddington and Roundshaw, and Wallington.
Heat vulnerability
The Met Office estimates that by 2070 if carbon emissions are not reduced:
- winters will be warmer by 1.9 to 3.3 degrees
- summers will be hotter by 3.6 to 5.0 degrees
- the hottest summer days will warm even more, by 3.7 to 6.8 degrees
- the frequency of hot spells will rise from once every four years to about four times per year
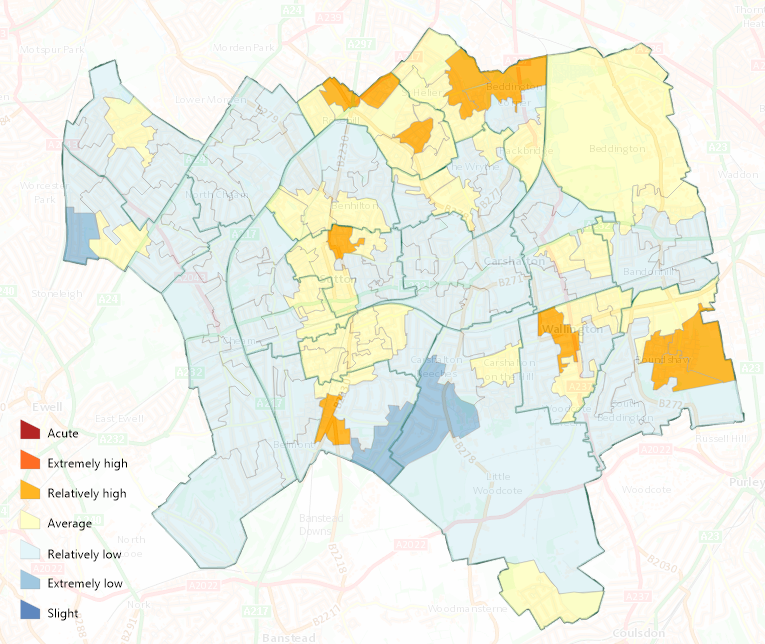
Negative social impacts map
This map shows where negative social impacts from increased heat are more likely. This is based on the level of vulnerability of each neighbourhood.
The risks are:
- slight for parts of Worcester Park South, Belmont, and Carshalton South and Clockhouse
- average for parts of Sutton North, Sutton West and East Cheam, Sutton Central, Sutton South, Belmont, St Helier West, St Helier East, Wallington North, Wallington South, South Beddington and Roundshaw
- relatively high for parts of St Helier West, St Helier East, Hackbridge, Belmont, Wallington South, South Beddington and Roundshaw
Help us improve our site by joining our user research panel